
Your Body Doesn’t Move in Straight Lines
The science of physiological dynamics—and why one number rarely tells the whole story
Heart rate rises and falls. HRV changes from night to night. Sleep varies. Temperature, breathing, stress response and recovery all move over time.
That does not mean the body is failing to regulate itself. Quite the opposite: a living system stays stable by continuously adjusting.
The scientific idea behind this is not one single “wave theory.” It is the intersection of several established concepts: homeostasis, allostasis, biological rhythms and physiological variability. Together, they explain why body signals rarely form straight lines—and why an isolated reading can be far less informative than the pattern around it.
The short version: Your body is not designed to hold every signal at one fixed value. It regulates, anticipates, reacts and recovers. What matters is not only where a value is now, but how it got there, how long it stays there, what changed with it and whether it is moving back toward your usual range.
Homeostasis is not a flat line
Homeostasis is often described as the body keeping internal conditions “constant.” That wording is convenient, but misleading.
Physiology is regulated around functional ranges, not frozen at one perfect number. Blood pressure changes when you stand. Heart rate rises when you walk. Body temperature follows a daily rhythm. Breathing changes with effort, emotion, altitude and sleep.
These movements are not exceptions to regulation. They are part of regulation.
Modern descriptions of homeostasis focus on coordinated feedback systems that keep important variables within viable bounds despite changing demands.[1,2] In other words, the body does not protect stability by eliminating movement. It protects stability through controlled movement.
Allostasis: stability through change
Allostasis adds another layer. It describes how the body adjusts its operating state to meet expected or actual demands.
Before you start running, your physiology prepares for effort. During infection, immune, cardiovascular and metabolic signals shift. After a poor night’s sleep, the same workout may produce a different response. With repeated training, the response itself can adapt.
This is why “normal” is contextual. A higher heart rate during exercise is appropriate. The same rise during quiet sleep means something different. A lower HRV after a hard training day may reflect short-term load; a persistent change across several signals may deserve closer attention.
Homeostasis and allostasis are not competing explanations. One describes regulation around viable ranges; the other emphasizes adaptation to changing demand and context.[1]
The body contains rhythms within rhythms
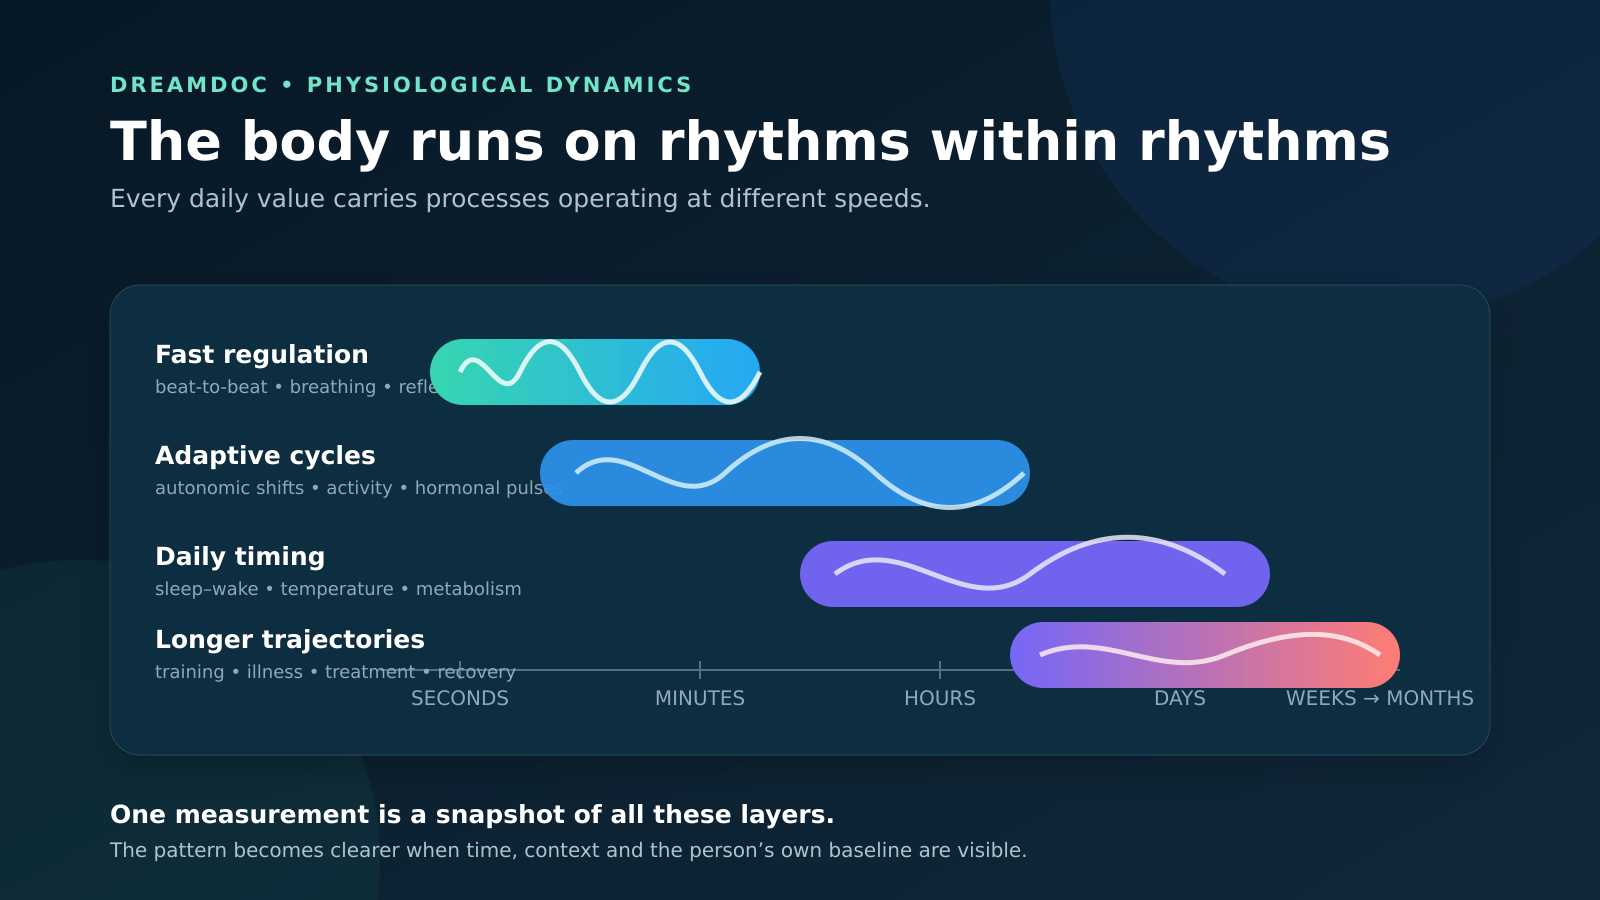
Some physiological movement is genuinely rhythmic. But not every wave repeats neatly, and different processes operate on very different timescales.
- Seconds: heartbeats, breathing and rapid autonomic adjustments.
- Minutes to hours: hormonal pulses, changing alertness, digestion, activity and sleep-stage cycles.
- Around 24 hours: circadian patterns in sleep–wake timing, body temperature, hormone release, metabolism and many cellular processes.
- Days to weeks: cumulative training load, recovery, immune activation, menstrual-cycle effects, medication response and behavioural routines.
- Months and longer: seasonal effects, conditioning, ageing, disease progression and longer-term treatment response.
Research on circadian coordination shows that clocks operate across tissues and organs rather than as one isolated “master switch.”[3] The endocrine system provides another clear example: cortisol is shaped by both a circadian pattern and shorter ultradian pulses. Researchers describe this as a state of continuous dynamic equilibration.[4]
So the visible line from a wearable is usually a mixture of multiple processes: biological timing, behaviour, environment, measurement conditions and the body’s response to them.
Variability can carry information
In engineering, variation is often treated as noise. In physiology, some variation is noise—but some reflects regulation.
Heart rate variability is the clearest familiar example. The time between consecutive heartbeats is not perfectly uniform. It changes under the influence of breathing, autonomic regulation, posture, activity and other factors. A healthy heart is not expected to behave like a metronome.[5]
Research in physiological complexity goes further: healthy systems often show structured variation across multiple timescales, while ageing or disease can alter that structure.[6] That does not mean “more variability is always better.” Excessive, irregular or unstable variation can also be a warning sign. The meaning depends on:
- which signal is changing;
- the timescale of the change;
- the person’s own usual pattern;
- activity, sleep, medication and other context;
- whether other signals move with it;
- and whether the system recovers.
The useful question is therefore not simply, “Is this number high or low?” It is, “What kind of change is this?”
The same number can tell three different stories
Imagine that today’s resting heart rate is 68 beats per minute. That single number could sit in three very different trajectories:
- It could be falling from 78 toward the person’s usual range during recovery.
- It could be stable around 68, with normal day-to-day variation.
- It could be rising from 58 and moving away from the person’s usual range.
The snapshot is identical. The direction and meaning are not.
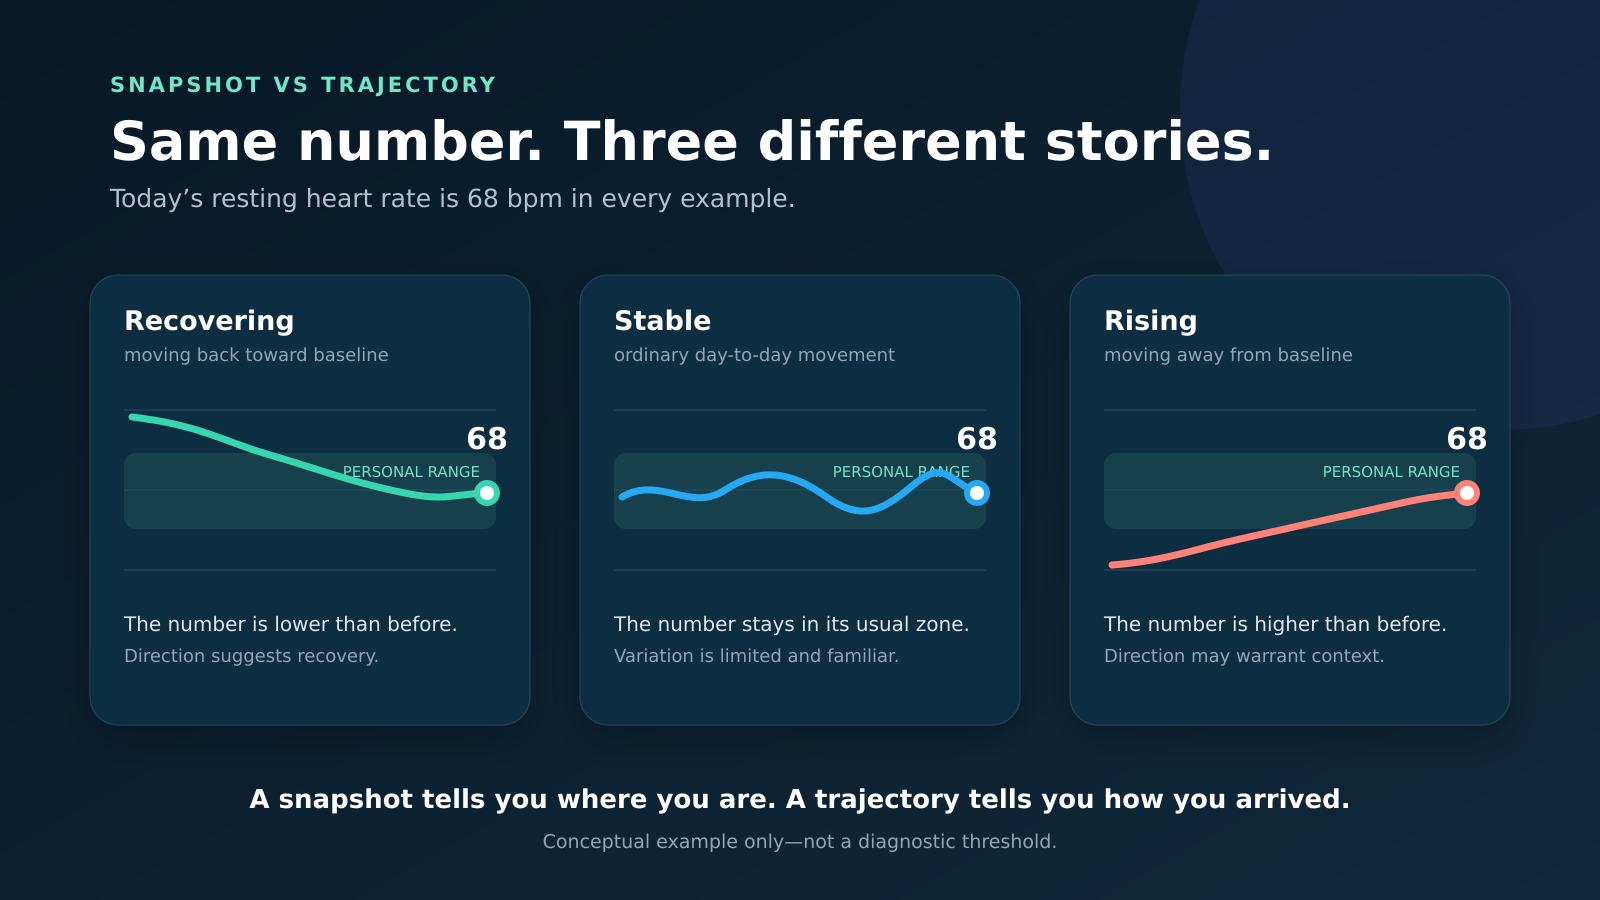
This is one reason population reference ranges alone are not enough for longitudinal monitoring. They are useful for answering, “Is this value broadly unusual among people like me?” They are less suited to answering, “Is this unusual for me, under these conditions?”
Personal baseline does not mean personal fixed point
A personal baseline is not one permanent average. It is an evolving model of what is typical for a person under comparable conditions—exactly what DreamDoc builds from Garmin night data in Your personal Health.
Large longitudinal wearable studies show substantial differences between people even for a familiar measure such as resting heart rate. In a study of 92,457 adults, individual resting heart-rate patterns also varied with factors including age, sex, sleep, body mass index and season.[7] Smaller intensive-monitoring studies have demonstrated personalised circadian patterns and used activity-adjusted longitudinal data to identify unusual physiological periods.[8]
A useful baseline therefore needs context. Depending on the signal, that may include:
- time of day and day of week;
- recent activity and training load;
- sleep and recovery;
- illness, symptoms and treatment;
- travel, temperature and altitude;
- medication, alcohol and other exposures;
- longer-term changes in fitness or health.
The baseline must be stable enough to make deviations visible, yet adaptive enough to learn when the person genuinely changes. That balance is harder—and more valuable—than calculating a simple rolling average.
Two dimensions: state and stability
One practical way to interpret longitudinal physiology is to separate two questions.
State: Where is the person relative to their personal baseline?
Stability: How much, and how rapidly, is the pattern changing?
These dimensions are related, but not identical. Someone can be close to baseline and stable. They can also be close to baseline but changing quickly. A signal can remain away from baseline yet become steadier during recovery. Or several signals can move away from baseline while becoming increasingly unstable.
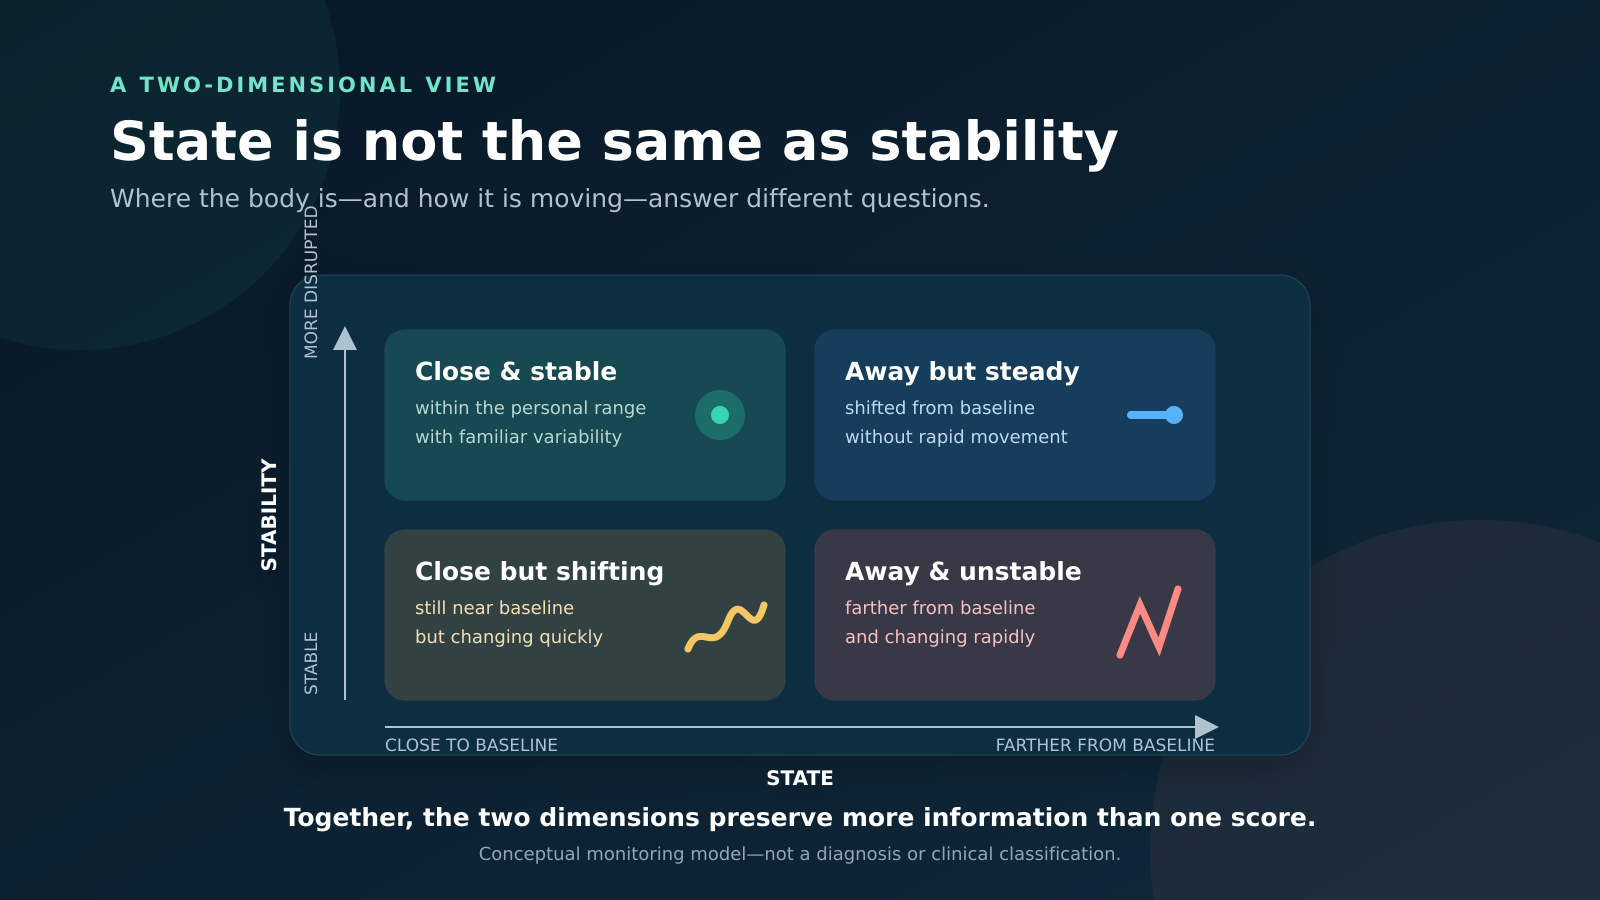
This distinction helps preserve information that a single “readiness” or “health” score can hide. It does not eliminate complexity, but it makes the complexity interpretable.
What becomes visible in longitudinal data
When data are sufficiently complete and interpreted in context, longitudinal monitoring can help reveal:
- Direction: Is physiology moving toward or away from the person’s usual range?
- Magnitude: Is the deviation small or substantial for this individual?
- Persistence: Is it a brief response or a sustained change?
- Coordination: Are several signals changing together?
- Recovery: Does the pattern return after sleep, rest, treatment or reduced load?
- Recurrence: Does a similar pattern appear under similar conditions?
None of these proves a diagnosis. But together they can create a more useful picture for reflection, monitoring and conversations with health professionals than disconnected daily numbers.
Where DreamDoc fits
DreamDoc is built around this longitudinal view. Instead of treating each wearable measurement as an isolated fact, the aim is to understand physiological dynamics around a personal baseline—together with the context that may explain them.
That means looking beyond “good” or “bad” numbers to ask:
- What changed?
- How unusual is it for this person?
- Is the change stable, accelerating or resolving?
- Which other signals moved at the same time?
- What happened around it—sleep, activity, symptoms, treatment or life events?
The goal is not to turn every fluctuation into an alarm. It is to distinguish ordinary movement from patterns that may be worth noticing, discussing or following more closely.
In practice, that science shows up in products you can use today:
- Your personal Health — how DreamDoc turns Garmin data into personal health intelligence.
- myBaselines on Garmin — night baselines for heart rate, stress, sleep and recovery on your watch.
- HRV+ and Reaction Time — resting HRV and alertness tests that add active context to overnight trends.
Built with research — open to collaboration
DreamDoc began in clinical and research settings. The ideas in this article are not marketing metaphors; they are the reason we compare each person with their own history, look at trajectories rather than single scores, and treat wearable data as a monitoring signal—not a diagnosis.
If you work in sleep, cardiology, sports science, occupational health, digital biomarkers or longitudinal wearable studies, we want to talk. DreamDoc can support research cohorts, partner clinics and teams that need personal baselines, continuous Garmin context and clearer patient or participant feedback.
- For medical studies — how we work with research protocols.
- Healthcare partners — collaboration for clinics and care teams.
- Contact DreamDoc — tell us what you are measuring and what you need to understand.
The limits matter
Wearables do not observe the body perfectly. Optical heart-rate measurements can be affected by device design, fit, activity and motion, and different derived metrics have different levels of validity.[9] Missing data, changing devices and inconsistent wear can also create apparent “changes” that are technical rather than physiological.
That is why responsible interpretation requires data-quality checks, context and uncertainty. A longitudinal model can support understanding; it cannot replace clinical assessment, validated diagnostic testing or medical judgment.
Health is not a still image
The body is a dynamic system. It regulates through feedback, adapts to demand and expresses rhythms across many timescales. Its signals move because life moves.
The most informative question is rarely “What is my number today?”
It is:
What is changing—and what does that change mean in the context of me?
That is the shift from snapshots to trajectories, from population averages to personal patterns, and from data collection to physiological understanding.
If that question matters for your own health, start with Your personal Health and the myBaselines app. If it matters for your study, clinic or product partnership, get in contact.
References
- Ramsay DS, Woods SC. Clarifying the roles of homeostasis and allostasis in physiological regulation. Psychological Review. 2014;121(2):225–247. doi:10.1037/a0035942
- Billman GE. Homeostasis: The underappreciated and far too often ignored central organizing principle of physiology. Frontiers in Physiology. 2020;11:200. doi:10.3389/fphys.2020.00200
- Mortimer T, Smith JG, Muñoz-Cánoves P, Aznar Benitah S. Circadian clock communication during homeostasis and ageing. Nature Reviews Molecular Cell Biology. 2025;26(4):314–331. doi:10.1038/s41580-024-00802-3
- Lightman SL, Conway-Campbell BL. Circadian and ultradian rhythms: Clinical implications. Journal of Internal Medicine. 2024;296(2):121–138. doi:10.1111/joim.13795
- Shaffer F, Ginsberg JP. An overview of heart rate variability metrics and norms. Frontiers in Public Health. 2017;5:258. doi:10.3389/fpubh.2017.00258
- Goldberger AL, Amaral LAN, Hausdorff JM, Ivanov PC, Peng C-K, Stanley HE. Fractal dynamics in physiology: Alterations with disease and aging. Proceedings of the National Academy of Sciences. 2002;99(Suppl 1):2466–2472. doi:10.1073/pnas.012579499
- Quer G, Gouda P, Galarnyk M, Topol EJ, Steinhubl SR. Inter- and intraindividual variability in daily resting heart rate and its associations with age, sex, sleep, BMI, and time of year: Retrospective, longitudinal cohort study of 92,457 adults. PLOS ONE. 2020;15(2):e0227709. doi:10.1371/journal.pone.0227709
- Li X, Dunn J, Salins D, et al. Digital health: Tracking physiomes and activity using wearable biosensors reveals useful health-related information. PLOS Biology. 2017;15(1):e2001402. doi:10.1371/journal.pbio.2001402
- Bent B, Goldstein BA, Kibbe WA, Dunn JP. Investigating sources of inaccuracy in wearable optical heart rate sensors. npj Digital Medicine. 2020;3:18. doi:10.1038/s41746-020-0226-6
Medical note: This article is educational and does not provide diagnosis or medical advice. Concerning symptoms or measurements should be discussed with a qualified healthcare professional.